Akash
Indian geek pythonista <3 vim & Linux.
Plot Histogram using OpenCV
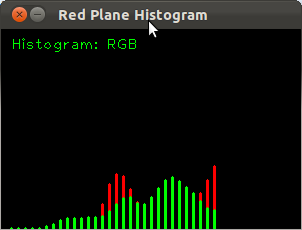
Histogram is a handy way of representing whatever it is that you have learned from image. Histogram of a image can be used to check whether image is too bright or too dark or contrast.
Plot Histogram
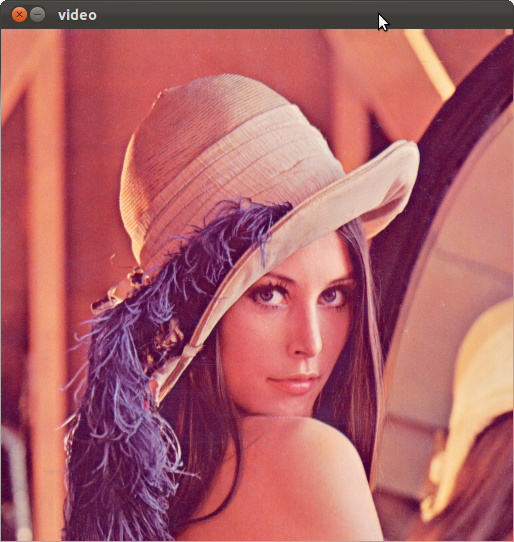
#Histogram.py
from numpy.ma.core import ceil
import threading
import time
from cv2 import cv
import cv

class Histogram:

    def __init__(self,inp):
        #temporary file

        if(inp==None):
            self.img=cv.LoadImage("backimg.jpeg") #temporary image
        else:
            self.img=inp #input from camera

        cv.CvtColor(self.img,self.img,cv.CV_BGR2HSV)

    #create temporary images to store Hue,Saturation, value planes
        self.planeR=cv.CreateImage(cv.GetSize(self.img),8,1)
        self.planeG=cv.CreateImage(cv.GetSize(self.img),8,1)
        self.planeB=cv.CreateImage(cv.GetSize(self.img),8,1)

        hranges=[[0,180]] #180 for Hue
        self.hist=cv.CreateHist([30],cv.CV_HIST_ARRAY,hranges,1)

    #another IplImage for drawing graph
    self.graph=cv.CreateImage((300,200),8,3)
        cv.Zero(self.graph)
        cv.PutText(self.graph,"Histogram: RGB",(10,20),cv.InitFont(cv.CV_FONT_HERSHEY_PLAIN, 1.0,1.0),(0,255,0))

    def SpliImage(self,img):
        if(img==None):
            img=self.img

        cv.Split(img, self.planeB,self.planeG,self.planeR,None)

        planes=[self.planeR,self.planeG,self.planeB]
        return planes

    def CalcHistoGram(self,plane_no=0,color="red"):
        out=self.SpliImage(self.img)
        cv.CalcHist([out[plane_no]],self.hist)
        cv.NormalizeHist(self.hist, 1.0)

        if(color=="red"):
            self.color=(0,0,255)
        elif(color=="green"):
            self.color=(0,255,0)
        elif(color=="blue"):
            self.color=(255,0,0)

        self.DrawHisto()

    def DrawHisto(self):
        #min,max,a,b=cv.GetMinMaxHistValue(self.hist)

        for i in xrange(0,30):
            val=cv.QueryHistValue_1D(self.hist,i)
            val=val*600
            v=ceil(val)

            cv.Line(self.graph,(i*7+10,200),(i*7+10,200-int(v)),self.color,2)


def HistoThread():
    h=Histogram(frm)
    h.CalcHistoGram(0,"red")
    h.CalcHistoGram(1,"green")
    #h.CalcHistoGram(2,"blue")

    cv.ShowImage("Red Plane Histogram",h.graph)
    del h #dereferencing h


if(__name__=="__main__"):
    cap=cv.CreateCameraCapture(0)
    threading.Thread(target=HistoThread()).start()
    while(True):
        t0=time.clock()
        frm=cv.QueryFrame(cap)

        cv.ShowImage("video",frm)
        t1=time.clock()
        print "time taken: ",t1-t0
        if(cv.WaitKey(10)>10):
            break